While inflation came in lower than anticipated in March, this positive development was overshadowed by ongoing news about trade tariffs. Read on for these updates and more.
· Consumer Inflation Eases in March
· Wholesale Inflation Also Eases, Key Components Cool
· Homeownership Remains a Solid Investment Option
· Elevated Unemployment Claims Persist
Consumer Inflation Eases in March
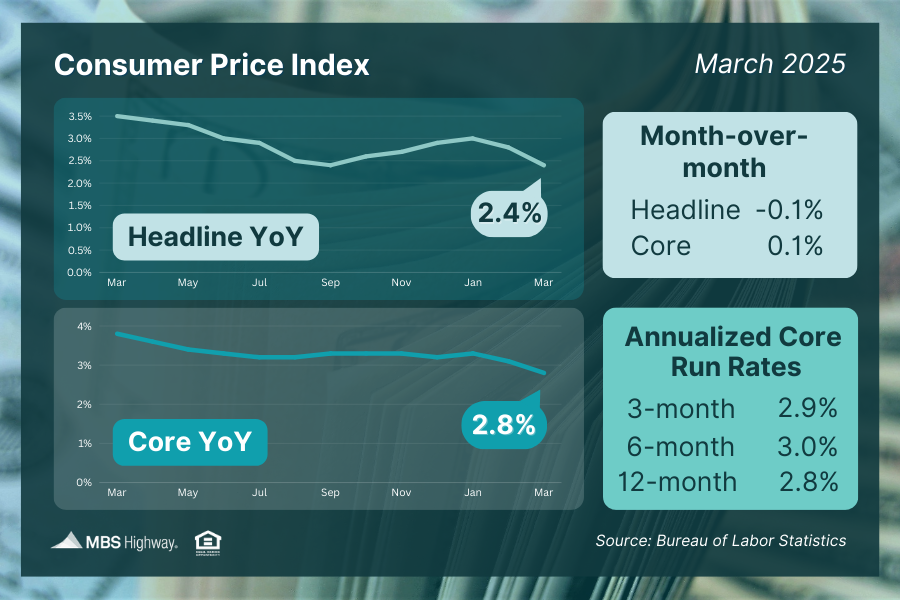
Inflation was cooler than expected last month, with both the headline and core Consumer Price Index (CPI) readings falling short of forecasts. Headline CPI dipped 0.1% from the prior month, while the year-over-year figure softened from 2.8% to 2.4% - a decline driven largely by a sharp drop in gasoline prices.
Core CPI, which excludes volatile food and energy costs, inched up 0.1% month-over-month but eased to a 2.8% annual rate, down from 3.1% previously. This marked the lowest core inflation reading since March 2021.
Shelter costs remain the primary driver of ongoing inflationary pressures, accounting for 35% of the headline CPI and 44% of the core reading. While shelter costs were relatively favorable in March, this was largely due to a significant decline in lodging away from home, which coincides with reduced travel and other signs of economic slowdown.
What’s the bottom line? The cooler-than-expected inflation report would normally be welcomed news for the bond market, as lower inflation helps preserve the buying power of fixed investments like mortgage bonds. However, the March data preceded the imposition of new tariffs, which have continued to be the major market driver.
Wholesale Inflation Also Eases, Key Components Cool
The Producer Price Index (PPI), a key measure of wholesale inflation, declined 0.4% from February to March, with the annual rate dropping from 3.2% to 2.7%. This was much cooler than the 3.3% reading that had been forecasted. The decline was largely due to a plunge in gasoline prices, like in the CPI report.
Excluding the more volatile food and energy sectors, the Core PPI still slipped 0.1% month over month, and the year-over-year rate fell from 3.5% to 3.3% - also below expectations.
What’s the bottom line? This PPI data is crucial, as it impacts the Personal Consumption Expenditures (PCE) index, the Federal Reserve's preferred inflation gauge. An analysis shows that many shared components, such as airline passenger services, portfolio management, and healthcare, were much cooler in March compared to February’s PPI report.
This suggests the upcoming PCE report (set for April 30) could also indicate easing inflation. However, with the PCE report covering March data, the market reaction may be muted if ongoing trade and tariff issues remain the key focus later this month.
Homeownership Remains a Solid Investment Option
Recent data shows that home prices across the nation continued their upward trajectory in February. According to Cotality (formerly CoreLogic), prices rose 0.3% during the month and 2.9% on an annual basis. ICE reported a smaller 0.11% monthly increase, with their index showing annual growth slowing to 2.7% in February from 3.4% in the previous report.
What’s the bottom line? Cotality forecasts a 0.4% increase in home prices for March, with an estimated 4.2% annual gain over the next year. This aligns with other industry projections of approximately 4% appreciation over the next year. Such forecasts affirm that homeownership remains an effective means for Americans to build wealth.
For example, purchasing a $500,000 home that appreciates 4% in a year would result in a $20,000 gain in home value – a solid return on the investment.
Elevated Unemployment Claims Persist
Weekly initial jobless claims rose slightly to 223,000, staying historically low. Continuing unemployment claims fell by 43,000 to 1.85 million, however they have remained persistently above 1.8 million since last June.
What’s the bottom line? While new unemployment filings are low, the elevated continuing claims suggest individuals are taking longer to find new jobs. With many people exhausting their 26 weeks of benefits, the stubbornly high number of continuing claims indicates underlying weakness in the labor market and a slower overall pace of hiring.
Related posts

Are U.S. Dollar Reserve Currency Fears Warranted?


Annual Inflation Rate Eases in March

Weekend Talking Points - 'Wild'
Ready to close more deals?
ListReports automatically delivers personalized marketing collateral to your inbox helping you engage with your customers and prospects.